|
 Home Home
 Projects Projects
 Experiments Experiments
 Circuits Circuits
 Theory Theory
 BLOG BLOG
 PIC Tutorials PIC Tutorials
 Time for Science Time for Science
|
| ||
|
6 December 2009 Author: Giorgos Lazaridis The Least Squares FittingWhat is this Least Square Fitting? This method is a mathematical procedure for finding the best-fitting line (for linear systems) or curve (for non-linear), for a given set of points. Using this method, the sum of squares of the offsets is used, instead of the offset absolute value. This means that to find a point on X axis, the Y axis is vertically increased or decreased. This causes sometimes a disproportionate effect on the fit which is not always desirable, but that depends on the problem itself. To understand this difference look at the following two images. The left one shows the way that the least squares fitting is working. The Y axis is vertically increasing or decreasing until the X value is returned. This is most of the time what the experiments request. The right image shows the perpendicular offsets.
The vertical offsets fitting is more simple and more often used method. Equations To calculate the vertical offsets fitting line, you need to make a series of calculations. Suppose that we have taken n pairs of X and Y values: First you calculate the Sum of X values: SumX = X1 + X2 + X3 + ...+ Xn Then you calculate the Sum of X2 values: SumX2 = X12 + X22 + X32 + ...+ Xn2 Next calculation is the Sum of Y values: SumY = Y1 + Y2 + Y3 + ...+ Yn And then, the Sum of X*Y pairs: SumXY = X1 * Y1 + X2 * Y2 + X3 * Y3 + ...+ Xn * Yn Using the calculations above, you can directly find the slope and offset of the best fitting line:
And:
To find two sets of X-Y points and draw a line, you use the line equation: Y = a * X + b You do this for two X-values and you get two Y-values. Example For this example, i use the Dr. Calculus Least Squares calculator to do the calculations Suppose that after an experiment, we acquired the following X-Y pairs of values:
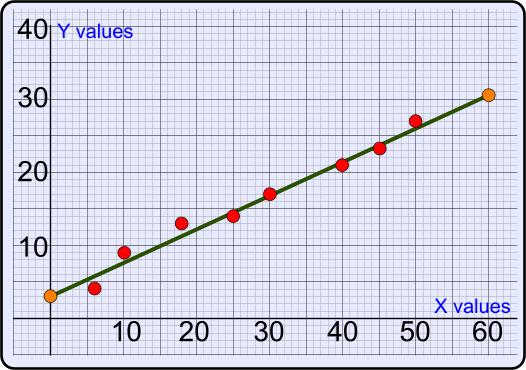
Now i will calculate the required sums: SumX = 224 SumX2 = 8110 SumY = 128 SumXY = 4433 And now, i will use the above numbers to find the slope and offset of the line: a = 0.46b = 3.07 Using the line equation, if will calculate the Y for two values of X. The first value will be zero (0) and the other 60: Y0 = a * 0 + b => Y0 = 3.07 Y60 = a * 60 + b => Y0 = 30.67 In the following diagram, the red points indicate the X-Y pairs taken from the experiment, and the orange points indicate the two X-Y pairs calculated using the least square method. The line that connects these two points is the best-fitting line: 
Relative pages Comments
|
|
 Contact Contact
 Forum Forum
 Projects Projects
 Experiments Experiments
 Circuits Circuits
 Theory Theory
 BLOG BLOG
 PIC Tutorials PIC Tutorials
 Time for Science Time for Science
 RSS RSS
Site design: Giorgos Lazaridis © Copyright 2008 Please read the Terms of services and the Privacy policy |