|
 Home Home
 Projects Projects
 Experiments Experiments
 Circuits Circuits
 Theory Theory
 BLOG BLOG
 PIC Tutorials PIC Tutorials
 Time for Science Time for Science
|
| ||
|
26 December 2009 Author: Giorgos Lazaridis Frequency MeasuringIntroduction It is essential to know how to measure frequency. The applications that needs frequency measuring are unlimited. From the very simple frequency counter circuit, up to more complicated projects such as car speedometers, motor rpm meters and much more, a frequency measuring circuit exists somehow. With this article i will try to explain the basic theory of digital frequency measuring techniques. Smoothing - Squaring - Amplitude fixing Before you begin measuring a frequency of a signal, you need to make sure that you have a clear rectangular signal, with certain amplitude. This is basically the most difficult thing in frequency measuring. There will be times that the signal is ideal, pure rectangular and noise-free. But there will be times that the signal to be measured is noisy and full of parasites. Here is an example of a 'bad' input signal: 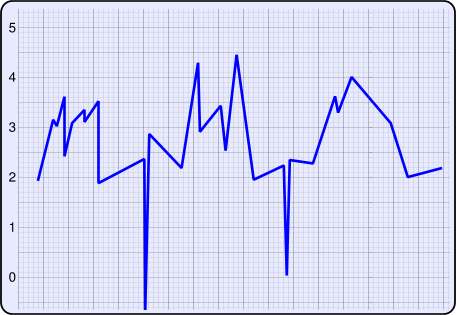
This signal is absolutely improper to handle. It has a DC offset of about 2 Volts, and huge voltage peaks. The first thing to do here is to use an RC circuit. A carefully selected capacitor along with a resistor, will eliminate all the ugly peaks and also it will smooth the signal. The value of the resistor and the capacitor have to do with the minimum and the maximum frequency of the signal. You need to choose a charging and discharging capacitor's time in a way that it will be fast enough to be 63.3% charged between each pulse. But it must not be too fast charged and discharged, because it will not smooth the signal very good. To find out more about the charging and discharging time of an RC circuit, follow this link: The Capacitor Now look what happens when the signal is filtered through the first stage of filtering, the RC filter. The orange line is the input signal, and the blue line is the signal filtered: 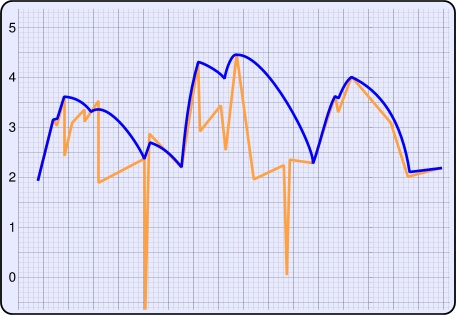
The difference is obvious in a glance. The peaks are gone and the pulses to be count are more clear now. Yet, they need to become rectangular. There are still small peaks in the signal that if are directly interfaced to an IC, it may measure them as a pulse. At this time, a Schmitt Trigger needs to be placed. The Upper and Lower threshold levels of the Schmitt Trigger needs to be chosen in a way that the false pulses will not be counted. Check out the output of the Schmitt Trigger. The orange line is the signal from the previous stages, while the blue is the output from the Schmitt Trigger. The horizontal lines are the upper and the lower threshold levels: 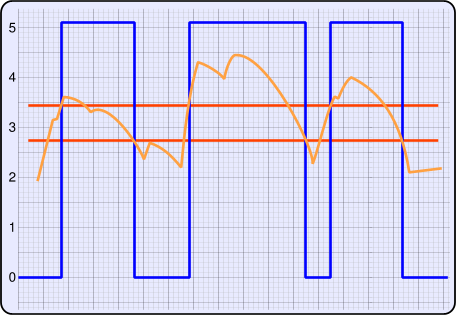
Now this is a perfect signal to measure. The three pulses are clear and there is no noise or sparkles. To learn more abouut the Schmitt Trigger, folloow this link: The Schmitt Trigger At the output of the ST, a diode is put in series so that the negative output of the ST will not pass through. Also, a Zener diode will keep the positive output of the ST up to 5.1 volts. The circuit used to clear the input signal is the following: 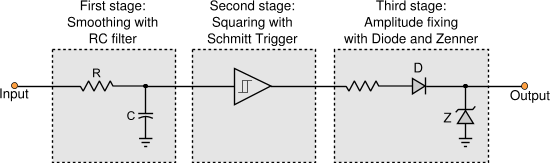
Two frequency measuring techniques I will distinguish the methods in two categories: The Direct Frequency Measuring (DFM) and the Reverse Frequency Measuring (RFM). No matter which method you use, you need to have a Timebase Oscillator Circuit (TOC). This circuit is a pulse oscillator with a fixed circuit. The higher the stability and the precision of this circuit, the better the measuring results. The frequency of this circuit will determine different parameters of the measuring results, depending of the method you choose to use. Dierct Frequency Measuring This is basically the most straight-forward method of frequency measuring. The TOC is oscillating in a rather low frequency. It's frequency will determine the sampling rate of the circuit. If for example it oscillates at 1Hz, you will get measuring results once per second. This method works as follows: During a complete period of the TOC, the signal pulses are measured. Then, the pulse count is divided by the TOC period. The result is the frequency in Hz:
F = The frequency of the input signal Cnt = The counted pulses T = the TOC period in seconds Look at the following example: 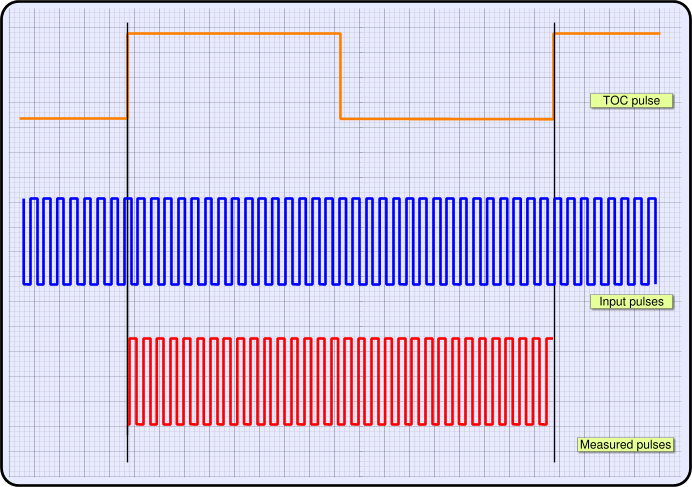
Suppose that the TOC frequency is 10 Hz, this means that the TOC period is 1/F = 0.1 Sec. The measured pulses are 32. According to the previous formula, the frequency of the input signal is: F = Cnt / T = 32 / 0.1 = 320Hz. Sometimes, especially when the circuit does not use a microcontroller, instead of the TOC full period, the counted pulses are measured during the HIGH or during the LOW period of the TOC pulses. To have a correct measurement of the frequency, the 'T' on the formula must have the period of the specific portion of the pulse used, and NOT the complete pulse period. What's good about this method, is that with properly selecting TOC frequency, you can have the signal frequency measured directly with no mathematics at all! For example, If the TOC is 1Hz, then the pulse count can be directly driven into a simple CMOS decimal counter circuit! If the TOC is 10Hz, then the same circuit can be used directly coupled, and have one decimal number! Here is a block diagram example: 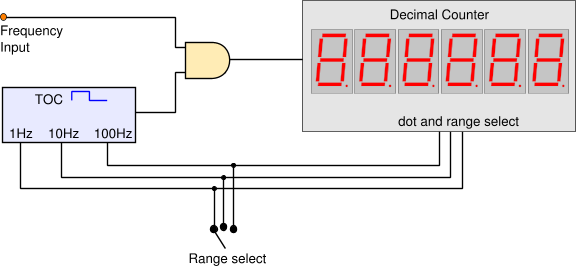
DFM Measuring Error The measuring error of this method, is increased, when the measuring frequency is decreased. This method can only measure pulses, thus it will always return integer numbers of pulse counts. If for example the TOC is 1 Hz, for a frequency of 100Hz, it will return 100 pulses. For 100,1 Hz it will return 100 pulses as well. for 100,9 Hz pulses it will also count 100 pulses. The accuracy is increased either when the counted frequency is increased, or if the TOC frequency is decreased. But as the TOC frequency decreases, so does the sampling rate of the circuit. For example, with 0.1 Hz TOC frequency, for 100 Hz measuring frequency it would return 1000 pulses, for 100.1 it would return 1001, for 100.9 it would return 1009 and so on. But the sampling rate would be 0.1Hz = 10Sec!!! That means, you would get readings only after 10 seconds! That is why this method is used mainly for high frequency measuring. The higher the better. In general, the accuracy of this method is reverse proportional to the frequency of the TOC, while the sampling rate is equal to the TOC frequency. Another characteristic of this circuit is that, during a measuring cycle, if the frequency is changed, the result measurement will be the average of the frequency! Suppose that you measure the rpm of an engine. The range of a car engine is usually from 600 to 6000 rpm. In seconds, this is 10 to 100 revolutions per second. If for each revolution we get one pulse, then we have a range of 10 to 100 pulses per second. We choose TOC frequency 1 Hz that has a period of 1 Sec. Now, if during this 1 Sec of measurement the rpm are increased and decreased, this change will NOT be shown. Instead, the final measurement will have the average! This is not important for a car RPM meter, but for other applications this is absolutely improper! Reverse Frequency Measuring This method is by far more accurate for low frequency measurements, and can also measure higher frequencies, not so high as the previous method though. For this method, the TOC must have very high frequency. The idea is to measure how many pulses of the TOC can fit within a full period of the counted signal! Look at the following diagram and you will understand: 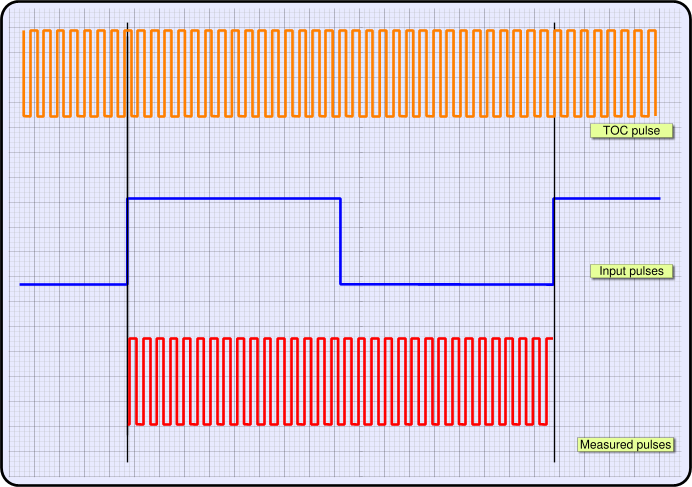
The orange pulses comes from the TOC, while the blue comes from the input signal. The hard thing is to calculate the frequency from the counted pulses. Suppose for example that we will measure two different signals. The first one is 1 Hz and the other one is 10 Hz. The TOC is 10 KHz. For the first one, the circuit will return 10.000 pulses. For the second case of the 10Hz signal, the circuit will return 1000 pulses! What someone can understand from this is that, as the measured frequency increases, the counting pulses are decreased! That's why i name this method 'Reverse'. To calculate the frequency, you need to divide the TOC frequency by the measured pulses. Here is the general formula:
F = The frequency of the input signal Cnt = The counted pulses T = the TOC frequency in Hz Unfortunately, this method requires most of the times a micro-controller to do the division. There are some very neat characteristics of this measuring method. One of these is that the accuracy of the measurement can be significantly increased, by simply counting the TOC pulses for more than one full period of the input signal. The formula to calculate the final frequency is:
n = The input signal full periods during which the TOC pulses are count RFM Measuring Error The measuring error for this method depends on the TOC frequency. The higher the TOC frequency, the less the error. I would recommend to have always a TOC frequency at least ten times higher than the maximum frequency to be measured. Another characteristic of this method is that, unlike the previous method, it can measure the frequency of each pulse separately. According to the speed of the micro-controller, it can achieve very accurate and really fast sampling rates! Which method to use? First of all, you need to answer the question: Is it possible a micro-controller to be used? If the answer is 'NO', then the only method possible is the Direct Frequency Measuring. If a micro-controller can be used, then there are other parameters that needs to be taken into account. In general, i strongly suggest the Reverse Frequency Measuring method. Someone would ask: Suppose that i use a PIC with 20 Mhz oscillator. The instruction cycle is 20/4 = 5 Mhz. So, the fastest TOC that i can achieve is 5 MHz. to have a valid reading, i need at least 10 pulses for each full period of the input signal. This means that i can measure MAXIMUM a 500 KHz signal. Right? WRONG! The answer is simple: Divide the input frequency! Use either a hardware divider, or the PIC built-in pre-scaller can also be used. Divide the signal by 2 for example. This will double the maximum frequency that can be measured! Actually, by dividing the input signal, you increase the full periods that the TOC pulses are counted. And as said before, the accuracy is multiplied by the number of the full periods. This will have of-course a negative result to the sampling rate and needs to be taken into account. The sampling rate will be n times slower than before. Relative pages Comments
|
|
 Contact Contact
 Forum
Projects
Experiments
Circuits
Theory
BLOG
PIC Tutorials
Time for Science Forum
Projects
Experiments
Circuits
Theory
BLOG
PIC Tutorials
Time for Science
 RSS RSS
Site design: Giorgos Lazaridis © Copyright 2008 Please read the Terms of services and the Privacy policy |


 Reddit this